The forecasts for the Bundestag election draw pictures in very different colors. Are there any regional peculiarities that influence the election intentions? A data -driven search for traces in the 299 German constituencies.
The finding is not new, but when looking at the forecasts of the Bundestag election, it still seems impressive: in Germany the political currents and the local support of the parties are very different. The differences between north and south, east and west go far beyond the previously known dividing lines.
Sure: Unlike older fellow citizens, young people in the big cities, workers tend to be different from employees in the public service or as students and civil servants. In the forecast distribution of the first votes, however, not only the large metropolitan areas catch the eye. Surprisingly clearly, the former course of the inner German border stands out in the coloring according to party preferences.
Is that due to locally grown beliefs? Or with specific problems in the different regions? Or are there other factors, such as demographic peculiarities? More than three decades after reunification, the country seems almost divided into the constituency forecast. In search of answers, a look at the official structure data is worthwhile: How does the elected population differ in German constituencies?
A simple cause of the course of the border lines lies in the hands of legislation: Germany's division into constituencies follows a precisely defined procedure. The standard for the division into the a total of 299 constituencies nationwide are the regional population and the population shares of the federal states.
The constituencies should be similarly large. If a constituency deviates from the average population of all constituencies by moving out or other developments “more than 25 from a hundred up or down”, “a delimitation must be made”, as the Federal Election Act states. In addition, there is also literally the specification that “the country borders” and “if possible” the borders of municipalities, circles and independent cities must also be “observed”. Thus, the line pattern of the constituencies in the middle of Germany inevitably also hugs the edges of the federal states and thus also to the former inner German border.
This would clarify the course, but not the political color. Why, for example, is the election behavior of Germans so different in the middle of Germany in the immediate vicinity? The search for possible explanatory approaches naturally leads deeper into the conditions on site.
Data from stocks of the Federal Statistical Office and other sources allow a closer look at regional differences between constituencies in East and West. Are the people there older or younger on average? Are they economic concerns or income? Or are the living situation or even the proportion of foreigners for the vote for one or the other party?
A first result: The situation on the labor market does not seem to have a clear influence on regional election behavior nationwide. The ten constituencies with the highest unemployment rate are all in the November 2024 comparison month, all in the west, the leader is 122 Gelsenkirchen with 14.8 percent. For comparison: In Thuringia, on the other hand, the nationwide quota was 6.0 percent in the same period and 6.5 percent in Saxony.
The constituency with the biggest unemployment problem in the east was according to the data of the Federal Employment Agency Chemnitz (constituency number 161) with 9.0 percent. Berlin was not included, the situation on the regional labor market was worse in the past autumn in 16 West German constituencies from Gelsenkirchen via Bremen, Mönchengladbach or Saarbrücken. Nevertheless, other parties are in front of the first votes. The division of the federal area alone can not go back to the situation on the labor market alone. Maybe the population density plays a role?
Here, too, the result is negative at first glance: the average number of residents per square kilometer naturally moves in the inner -city constituents in much higher areas than in the country. A clear pattern cannot be derived from this: Candidates of the SPD, for example, are far from being in front of all the metropolitan areas characterized by industry and workers.
In the east there are nine of the ten constituencies with the slightest population density and with the most extensive areas nationwide. However, there are also entire regions in the west that fall far below the nationwide average in the case of space -related population – without having a similarly uniform political color as in the east. The region with the highest population density is the Berlin constituency 82 “Friedrichshain -Kreuzberg – Prenzlauer Berg Ost”. There, the calculation resulted in around 12,190 Germans per square kilometer.
The question of whether people in a region are more likely to choose left or right has nothing to do with the topic of migration. In the East German federal states, the constituencies – apart from Berlin – tend to have lower foreigners than in the west. The evaluation of the offers of the federal election manager builds on data from the state offices and indicates the overall economic regions for the foreigners rather than any integration problems or overload reactions in the constituencies.
On closer inspection, this is no wonder: the numbers only record the proportion of residents on site that have a different one than German citizenship. The regional proportion of foreigners not only includes people from Ukraine or asylum seekers, but also also better integrated EU citizens from other European countries, such as the data from the surrounding area of the Frankfurt banking location, the Hamburg Commercial Center or the Publishing and Media City of Munich.
The data on the regional economic power demonstrate: prominent industrial locations such as Wolfsburg, Stuttgart or Ingolstadt not only attract workers from home and abroad. They also protrude significantly in the ranking of the economic strongest German regions. The economic strength of the regions is compared by a key figure that statisticians have calculated especially for the election for each individual constituency. For this purpose, the regional contribution to the German gross domestic product is broken down to the constituency boundaries and placed in relation to the population.
Particularly wealthy regions such as Düsseldorf, Hamburg and especially the constituency 220, “Munich-Land”, significantly distort the cut. There the ranking recorded a purely calculated GDP contribution of almost 120,000 euros per inhabitant. Apart from somewhat lower, but still similarly impressive values in Frankfurt, Düsseldorf and Stuttgart, there is a comparatively well -mixed picture in the area: According to this line -up, the economically weakest region is even clear in the west. It is the constituency with number 20, “Gifhorn – Peine”, which, according to statistics, only comes to 22,800 euros for GIP Pro head.
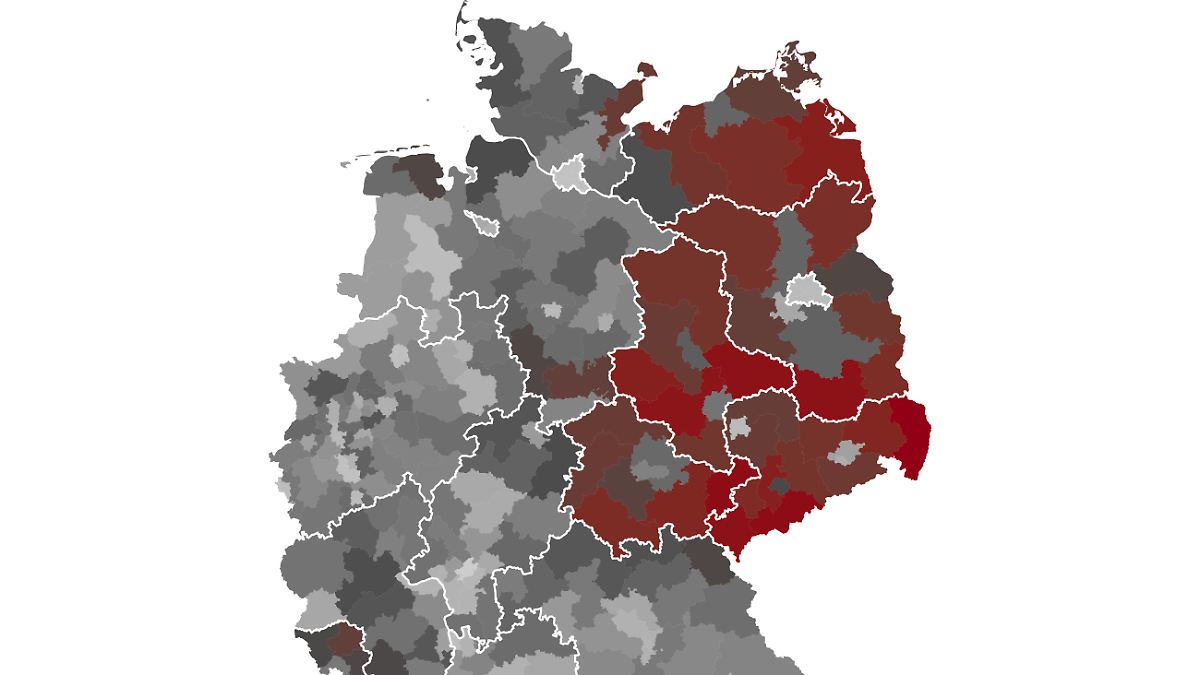
But what about demographic composition in the constituencies? The strongest optical connection is actually visible in this sample based on the age of age. At first glance, the result seems obvious, the demographic change is known to strike more in the east than in the west, reinforced by an often decades -old trend towards emigration. So far, politics and all efforts to align living conditions have apparently not managed to stop the younger people in the area countries of the East.
The electoral forecast may also also draw the image of an increasing extension of the population entitled to vote. A well -proven thesis is: The young, higher -educated and more agile voters tend to move into the economic regions rather than their older, less well -trained and more immobile neighbors. The cities grow, the country and the structurally weaker regions are increasingly gliding into aging. It is obvious that such a segregation does not remain in the long term without consequences for the composition of the regional electoral population.
No simple answers possible
But: Is the higher proportion of senior citizens and the election intentions a causality or just a sham context? Nationwide, the proportion of seniors – measured here in the number of over 60 year olds in the total population – is 29.9 percent across all constituencies. The quota is significantly higher in many East German constituencies. And particularly noteworthy: in the color gradation, the former inner German border emerge almost similarly strikingly as on the cards to the electoral forecast.
So has the question already answered? There are certainly no simple answers here. At best, individual structural features such as age, economic strength or regional perspectives only provide information. With certain restrictions, the senior quota can be understood as an indicator of impending or existing demographic imbalances in the German regions. However, individual election intentions alone cannot be explained.
After all, the evidence of demographic changes in society form a trace. For solid explanations, there are a lot of more precise studies, which also take into account the different perspectives and, above all, the life experiences of the people on site. After the election, experts will also look for more detailed answers in representative election statistics and other surveys.
The political division of Germany according to colors has so far only existed on paper anyway. The prediction for the expected distribution of the first votes confirms a picture that was already recognizable after the European elections in summer 2024. The forecasts of the election researchers do not necessarily have to fulfill themselves on election Sunday, February 23. It is still open, for example, how many voters are actually using their right to vote on site – and which party they make their cross.